Object
ra, dec 10.9268, 37.4217
AT 2018klt
LAMOST J004342.54+372519.9
LEDA 2100384 - Seyfert 1 galaxy
Using the Transient Name Server, SDSS and VizieR I might have discovered a periodic variable QSO / Quasar / AGN with a (super-) period of 578.8 days
I ask anyone with available telescope time, an interest in periodic AGN and willing to take a gamble to observe this object in the period around 19-09-2023. The next flare up is guesstimated to occur on 19-09-2023 but given the uncertainties of the actual (super-)period and duration of a flare-up it might be better to take a range of 10-09-2023 through 25-09-2023.
I discuss all my reasoning in this GZ thread
tl;dr
The first detection dates of 3 entries in TNS in combination with a single SDSS observation are pretty solidly hinting at a period of 578.8 days
Additional data from VizieR hints at an actual period of 57.88 days and a super-period of 10 * 57.88 days = 578.8 days
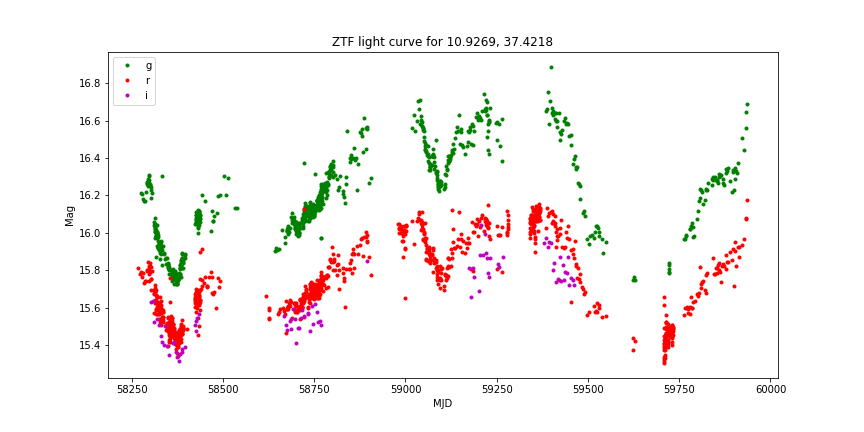
Well I can at least see clearly the outbursts from 2018,2020 and 2022 so that’s reassuring, the middle one from 2020 is like a dimmer peak because the whole system / source had dimmed, yet it had to peak, awesome but more crazy than I thought it would be!
Isn’t this similar to a TESS lightcurve for a double (star) system? I forgot a lot about that Zooniverse project…
Still, the guesstimate for halfway sept this year still stands! But likely a ‘dimmer peak’ like 2020 if the graph is representative of the period?
By eye it seems this source varied from mag 16.7 to mag 15.3 (~1.4) in the ZTF lightcurve which puts it in the ‘extreme variability quasars’ category?
They’ve found “~40 quasars that vary by more than 1.5 magnitudes”, and “~1000 spectroscopically confirmed quasars that vary by 1 magnitude or more”, so I guess they are not that rare persé
Tis more variable than usual though so nice find. I figure an extra one would still be loved by researchers given that no one seems to fully understand why they are variable.
Gotta be careful when looking at that light curve as it shows 3 different bands. The g band does seem to have the highest variablity, though only varies between ~16.7 and ~15.7. An variablity of ~1 mag.
There are plenty of zooniverse projects that deal with lightcurves; I am sure the researchers there wouldn’t mind helping with any extraction/folding or even observation time.
(If you increase the radius above 2.1", I think it’s finding a different source - I haven’t looked too carefully, but if you look at the “distance” and “angle” columns (at the far right of the table below), they’re different, and the first six entries are g,r,i bands in two different chips in the camera, so I think they’re correct.)
I selected the top 6 and clicked the “To time series tool” button.
And then clicked the “Download Light Curve” button.
That yields a FITS table with columns “filtercode”, “mag”, “magerr”, etc.
To make plots and stuff I write little Python scripts. I like the “fitsio” package for reading FITS tables, but astropy is also a popular option. (fitsio is lighter-weight, doesn’t try to be so fancy.) And then plot with matplotlib.
Presumably one could instead convert the FITS table to CSV and use a spreadsheet or whatever program. Or perhaps the “Topcat” program would also work.