Aladin Desktop works fine with FITS images normally though
The point where you clicked ‘‘Download Light Curve’’ theres also another option to simply click on the ‘oid’ which takes you to the Times Series Tool (viewer), where you can interact with the lightcurve graph. Haven’t found a way to merge 2 or 3 band lightcurves like you did though… But it works for me anyway to gather precise data
On we go…
Well if anything has become clear to me it is that the ‘Discovery Dates’ on TNS are pretty much useless when it comes to the real peaks of outbursts…
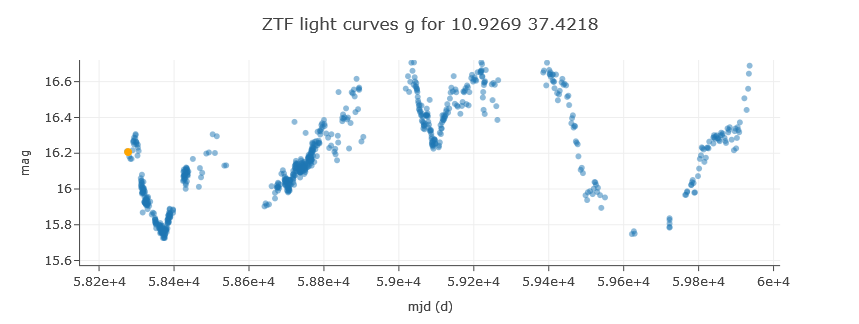
The first peak of 2018 is quite clear in the data, no issues there
The second peak of 2020 seems to be missing just a few data point at the exact top of the peak, but close enough anyway
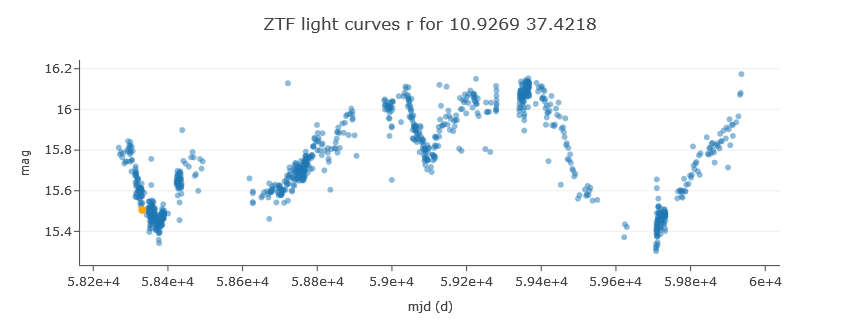
The third peak really misses data points, likely at top peak. So I have to settle with the brightest point from r band for that one.
Which gets me three dates for the three recorded peaks (DD-MM-YY)
15-09-2018
10-09-2020
08-05-2022
As is obvious the discovery dates from TNS are way off from these peaks;
20-12-2018
01-07-2020
12-02-2022
Days between peak 2018 and peak 2020: 727 days
Days between peak 2020 and peak 2022: 606 days
So not really a solid period for the observed timeframe… Assuming this thing does have a predictable period like the Eclipsing Binaries, as by eye it might be a symmetrical curve, it should now refert back to the first timeframe and observe ~727 days between peaks.
Counting from 08-05-2022 that would take us to (DD-MM-YY)
04-05-2024
If it isn’t just chaotic all the way down…
1 Like
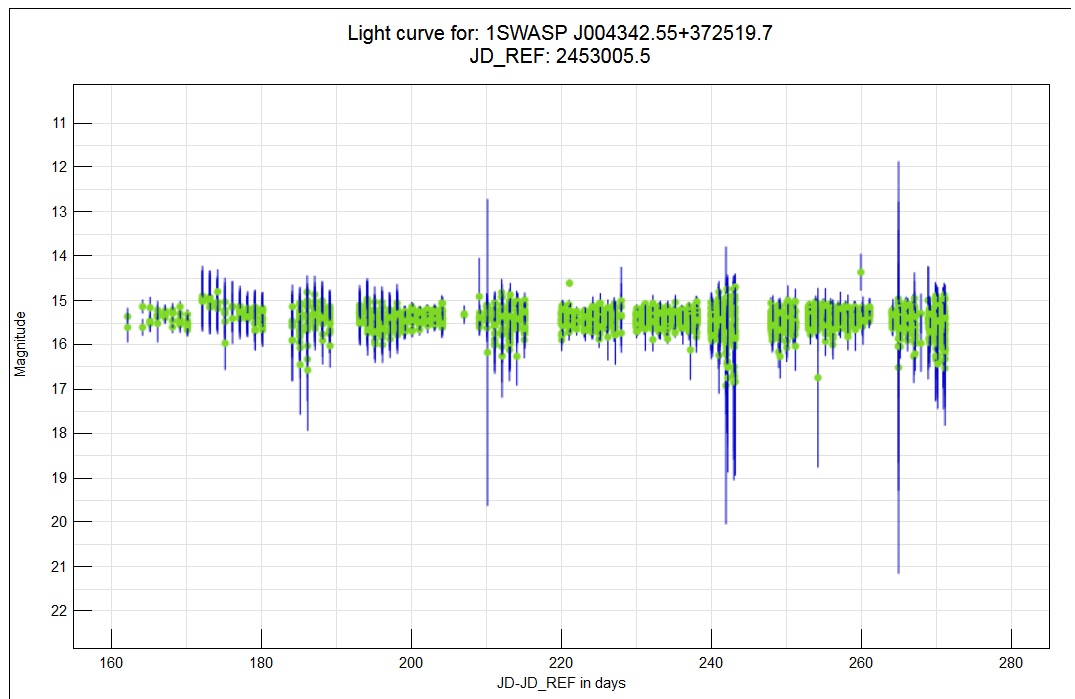
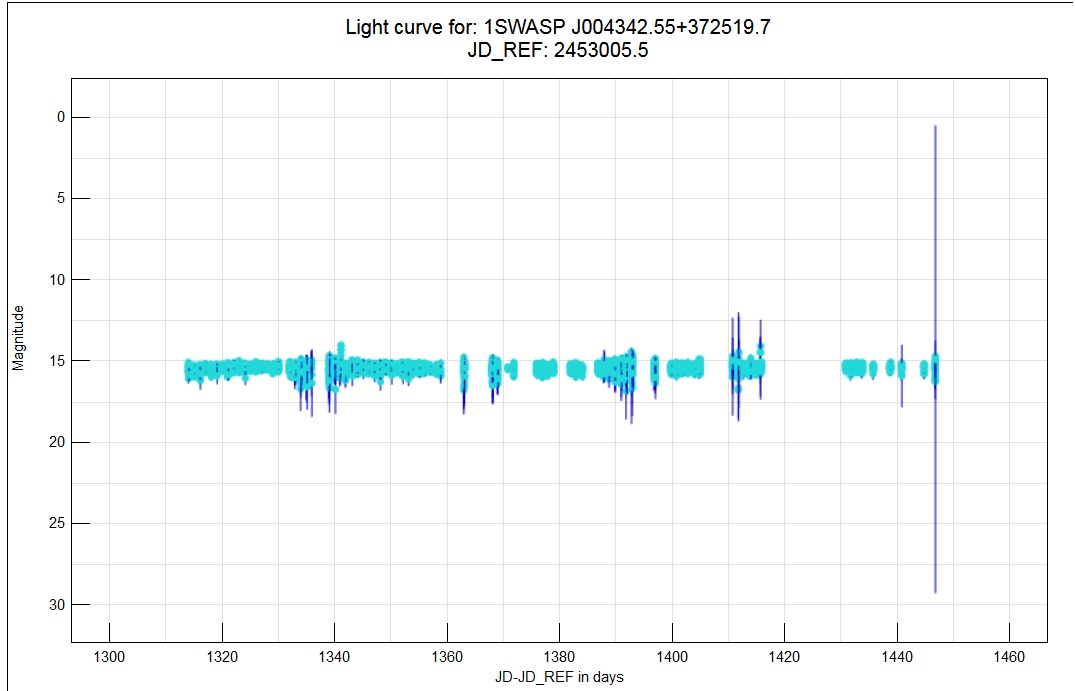
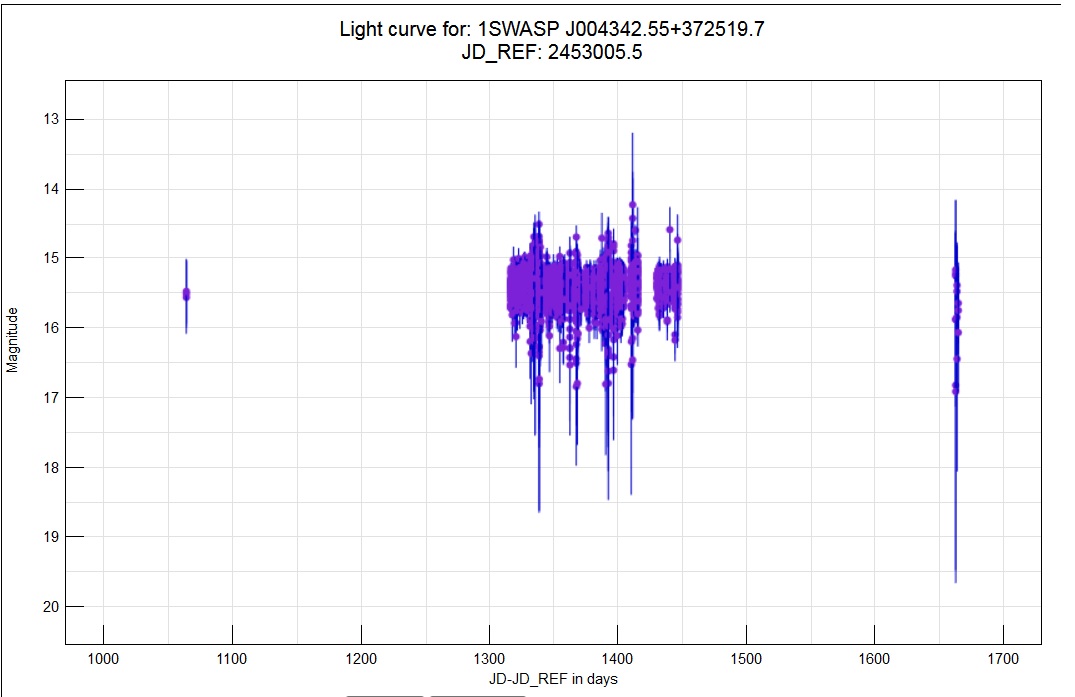
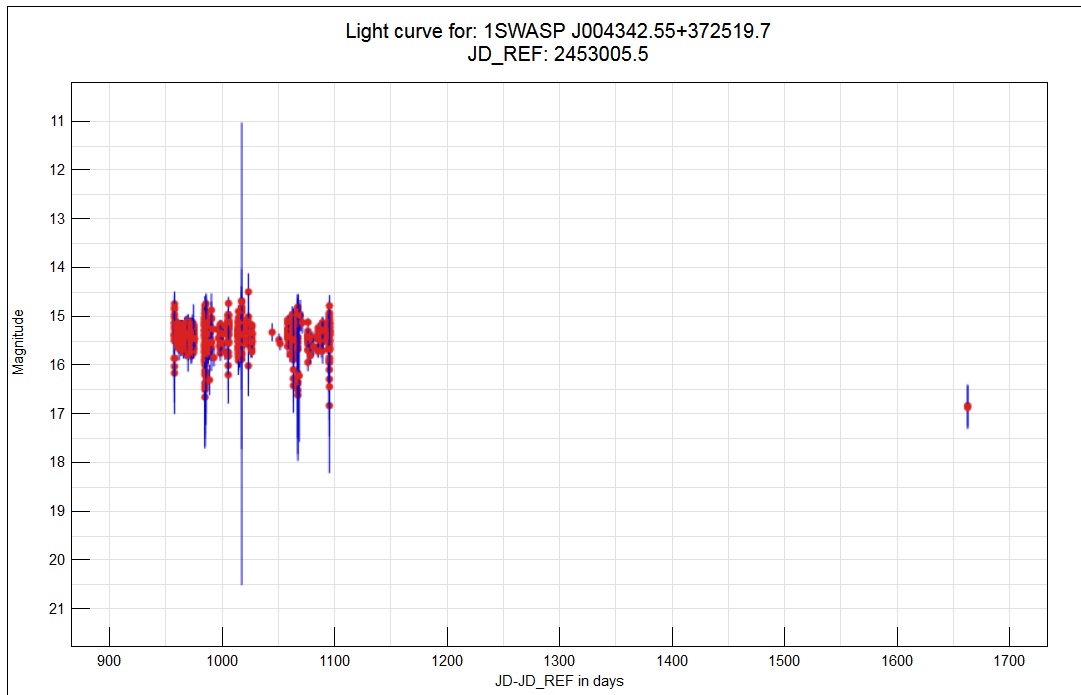
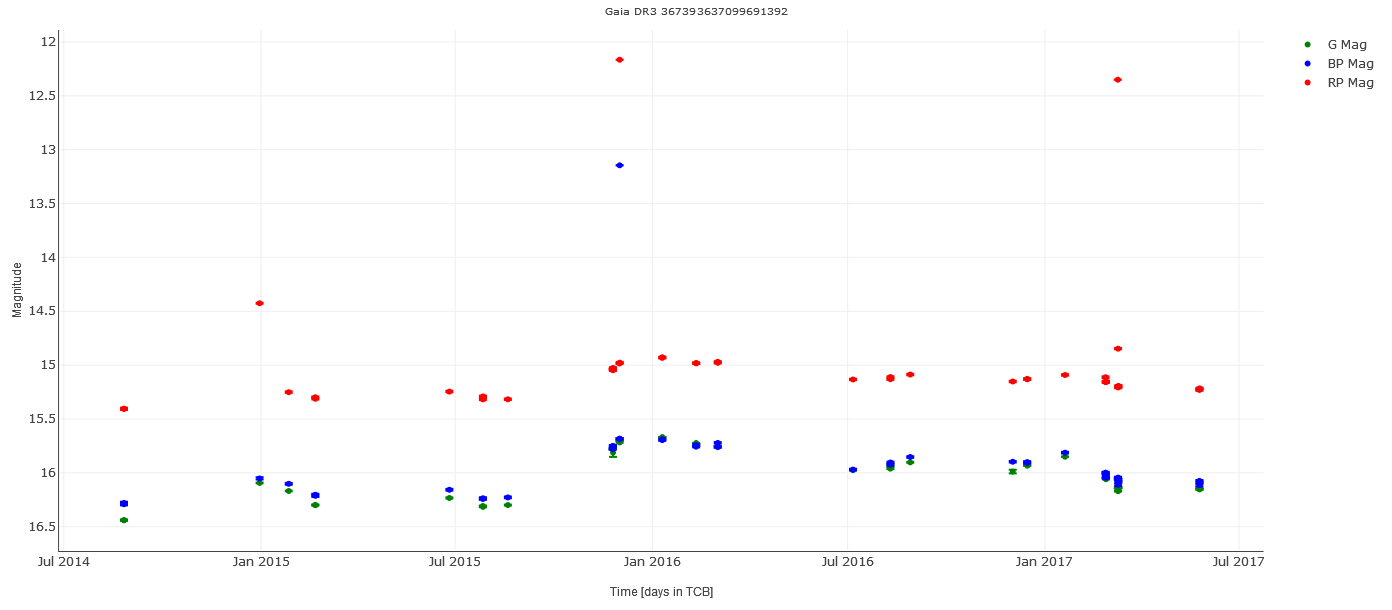
GAIA (july 2014 - july 2017) & SuperWASP (2004-06-11 - 2008-07-23) lightcurves, so more info from before the ZTF lightcurves starting somewhere 2017/2018 to 2022/2023)
Still working on getting acces to TESS lightcurves. Apparently this should be possible through the MAST Portal but I am not getting the ‘Timeseries’ button to view lightcurves. Perhaps this is only an option for logged-in account holders? (This is not explained anywhere but I’ve seen on a MAST youtube video where the icons should appear, and I am not getting them)
Looks like perhaps two more peaks in GAIA data? Very few data points to be certain.
Not sure why the SuperWASP data has such a wide spread of magnitudes, it would suggest the object is pretty variable on a shorter timescale?
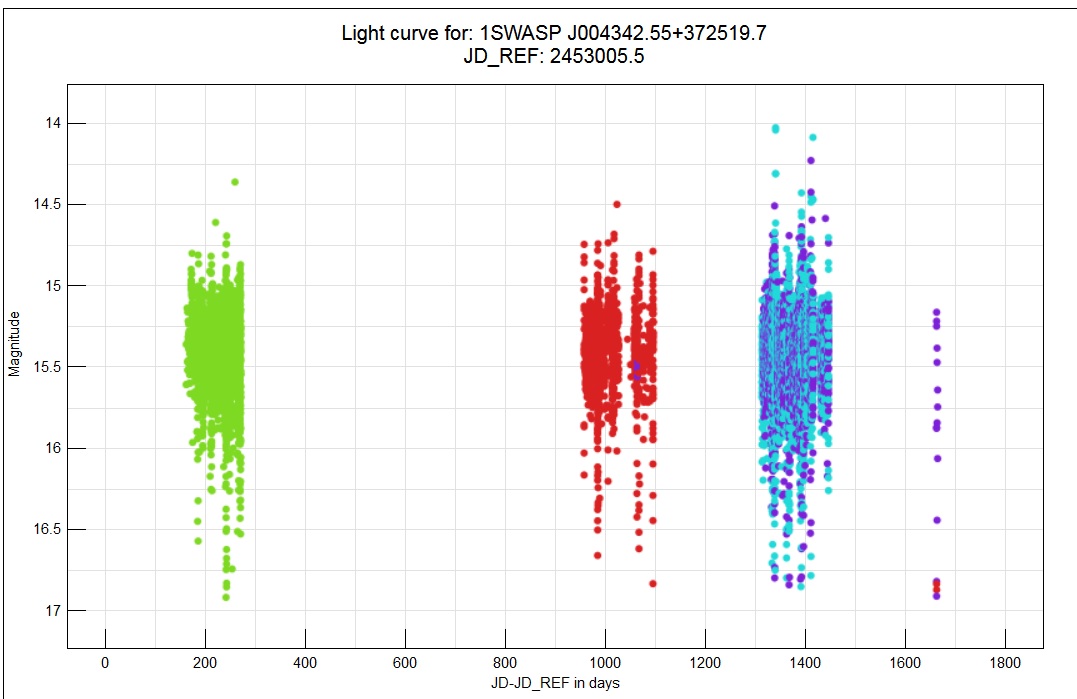
It would be worth knowing the uncertainties on the magnitudes reported int he superwasp data – if they’re ± 0.2 mags the those clouds of points would be consistent with a constant real mag measured by a noisy instrument.
cheers,
dustin
1 Like
lol I kept those out for clarity of the chart ![]()
But uncertainty wasn’t that great per photometric point, will come back on that
I must’ve been misstaken for the uncertainties on the magnitudes for the superWASP data, perhaps had the GAIA data in mind, images from the superWASP team data per individual camera used including error bars. The larger the difference between data points the larger the error bars seem to become, so it seems it’s more stable at around ~ 15.5 mag
Which seems inconsistent with the the ZTF lightcurve; both the superWASP (2004 - 2008) & ZTF (longer than 2018 - 2022) data cover a period of at least 4 years or more.
From superWASP 4yr data it seems stable around one particular magnitude
From ZTF 4yr+ data it is clearly variable on the timescale of years
From GAIA 3yr data it seems pretty stable except for two possible peaks of nearly 3 magnitudes difference
Confusing stuff tbh